In the era of information overload, data visualization plays a crucial role in shaping public perception. Whether it’s in media, business reports, or research, charts and graphs have the power to clarify complex data. However, not all visualizations tell the truth. Some charts are designed—intentionally or unintentionally—to mislead audiences, creating false narratives and misinterpretations.
FlowingData’s Dishonest Charts project (link) is a compelling exploration of how subtle (or not-so-subtle) distortions in graphs can misrepresent reality. From manipulated axes to selective data inclusion, these techniques can create misleading impressions that influence decision-making, policies, and public opinion.
Common Ways Charts Mislead
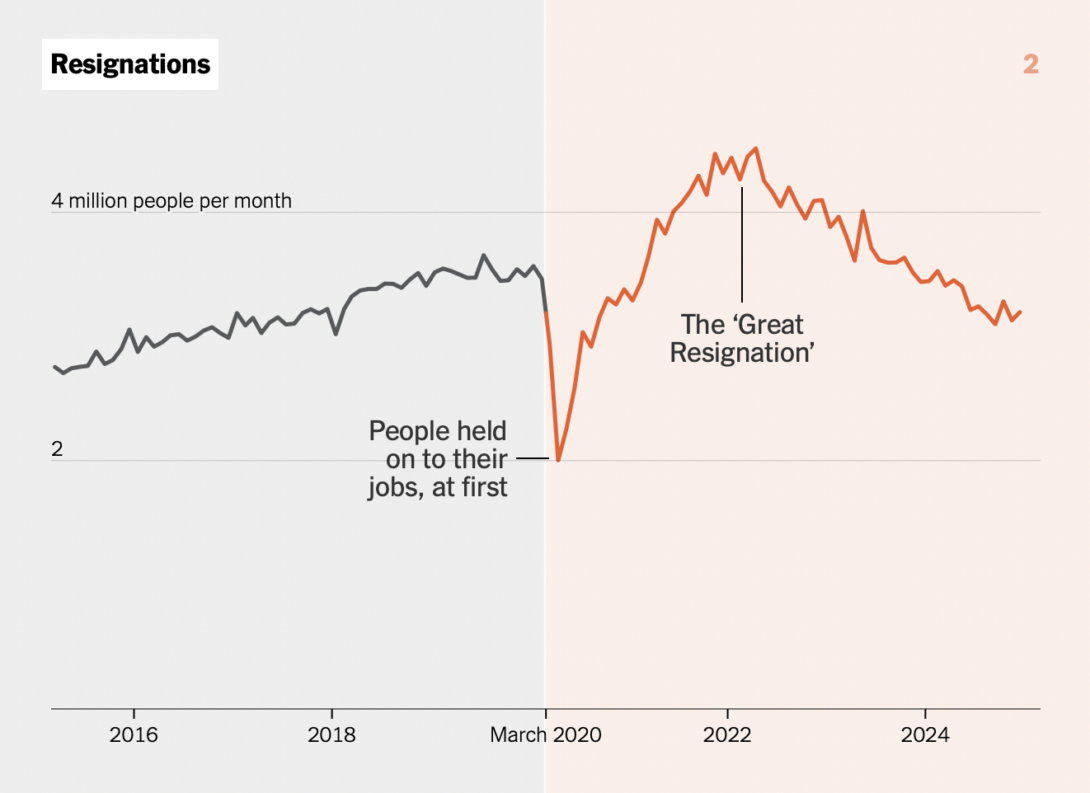
1️⃣ Truncated Y-Axis: A chart that doesn’t start from zero can exaggerate minor differences, making trends seem more dramatic than they are.
2️⃣ Selective Data Inclusion: Choosing only a subset of data points to fit a narrative can hide important context.
3️⃣ Improper Scaling: Adjusting proportions or using inconsistent intervals distorts the message.
4️⃣ Overuse of 3D Effects: 3D charts can obscure accurate comparisons, making some values appear larger or smaller than they really are.
5️⃣ Reversed Axes or Misleading Labels: Reversing scales or using unclear labels can confuse readers and alter interpretations.
The Responsibility of Ethical Data Visualization
At ART Lab, we emphasize data ethics and responsible communication. Researchers, designers, and analysts must ensure that the data they present is accurate, clear, and free from bias. Misleading charts don’t just affect numbers on a screen; they shape real-world decisions, from public policies to financial markets.
As consumers of data, we should always question the sources, analyze the visuals, and verify the context before accepting a chart at face value.
🔍 Check out FlowingData’s Dishonest Charts: https://flowingdata.com/projects/dishonest-charts/
📊 Let’s commit to honest and ethical data storytelling.
#DataEthics #HonestCharts #DataVisualization #ARTLab